🥷 [S2] Challenge 26
· 阅读需 1 分钟
Just KNIME It, Season 2 / Challenge 26 reference
Challenge question
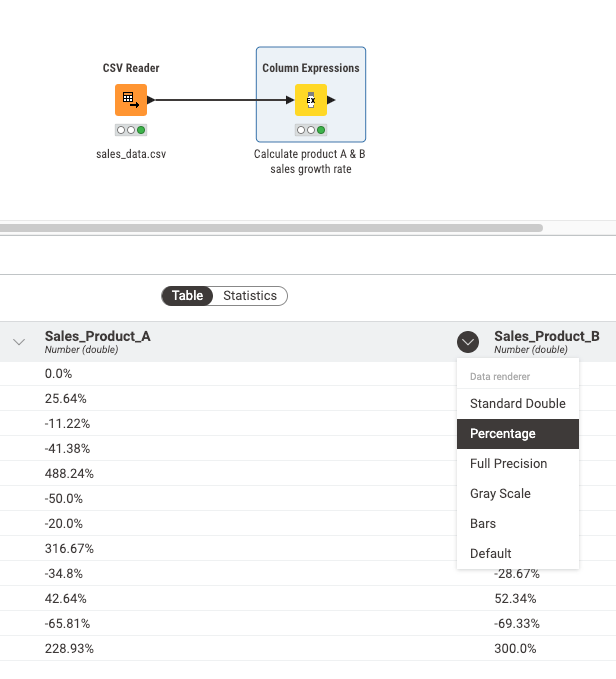
Challenge 26: Calculating Sales Performance
Level: Easy
Description: You work for a company that sells two products: Product A and Product B. As a data analyst, you want to calculate how sales increased or decreased for both products over a period of 12 months, on a monthly basis. In the end, you want to have a table with columns indicating the increase/decrease percentages of sales per month, as in the example below.
| Month | Percentage_Sales_Product A | Percentage_Sales_Product B |
|---|---|---|
| February | 45 % | 100% |
| March | 78% | -87% |
Author: Sanket Joshi
Dataset: Sales Data in the KNIME Hub
Any thoughts?
- I'm trying to use the KNIME AI Assistant. With the prompt "using the CSV node, I want to have a table with columns indicating the increase/decrease percentages of sales per month," it suggests a new CSV reader node and a "moving xxx" node. I realize that this AI lacks the ability to understand context. If I select certain nodes in the workflow, it starts building from those nodes onwards. The selected nodes will be its context, which I believe would be more helpful.
- I will think about how to express this idea and then post a suggestion in the forum.