🥷 [S2] Challenge 09
Just KNIME It, Season 2 / Challenge 09 reference
This is just a benchmark work.
Honestly, I find this question quite challenging due to two main factors. Firstly, there is an imbalance in the data which makes it difficult to improve accuracy. Secondly, interpreting feature importance is also a challenge, even though the task only requires us to display feature importance in order.
I believe this is a regression problem rather than a classification problem. While the quality scores in the dataset are integers, they have different sizes. If we use regression and the true quality of the wine is 6, a prediction of 5 would not be too far off. However, if we approach it as a classification problem, both a prediction of 5 and a prediction of 2 would be considered incorrect. Although they may not seem vastly different, they actually have significant distinctions.
I generated a string variable called 'quality_str' and used it for sampling. Then, I inputted it into the "H2O Random Forest Learner (Regression)" to obtain the result.
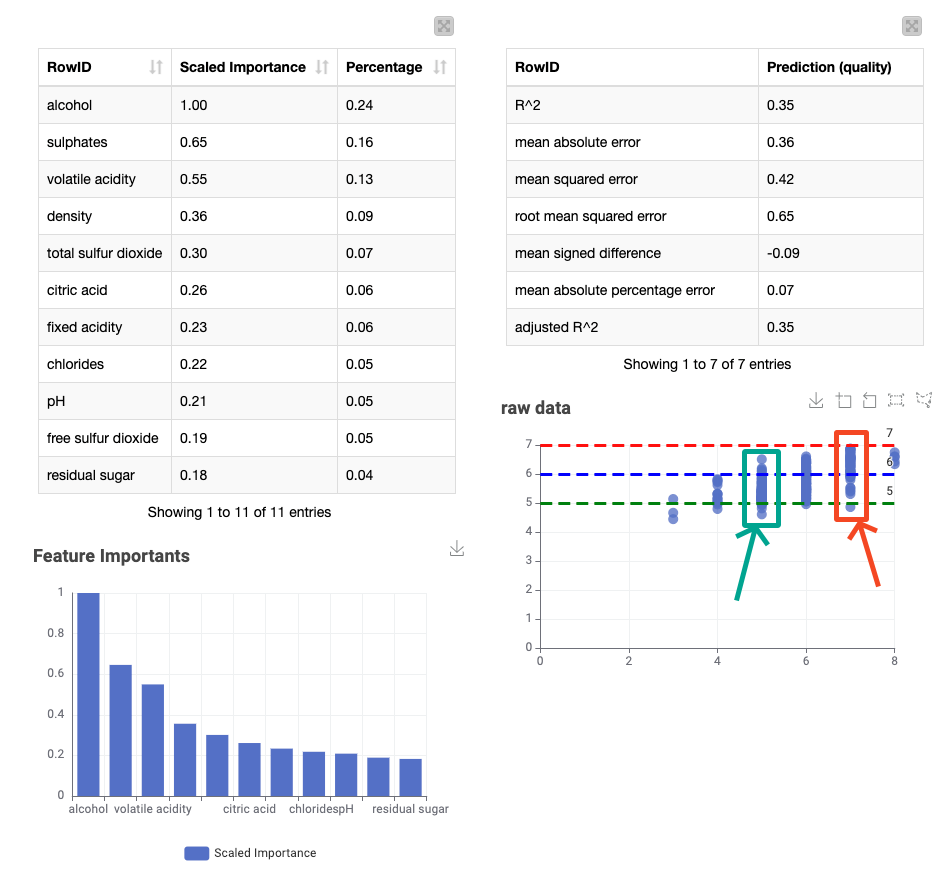
The visualization of the prediction data at the end is noteworthy. The horizontal axis represents the actual values, while the vertical axis represents the predicted values. Notably, the predicted result is slightly skewed towards 6 when the actual value is 5, as shown in the green box. Similarly, the value that is actually 7 is also biased towards 6, as shown in the red box. A potential solution to this issue could be an increase in features, but no such attempt was made.
Regarding the interpretability of machine learning, there isn't much time to address this challenge this week. It's a pity.