🥷 [S2] Challenge 02
Just KNIME It, Season 2 / Challenge 02 reference
Process
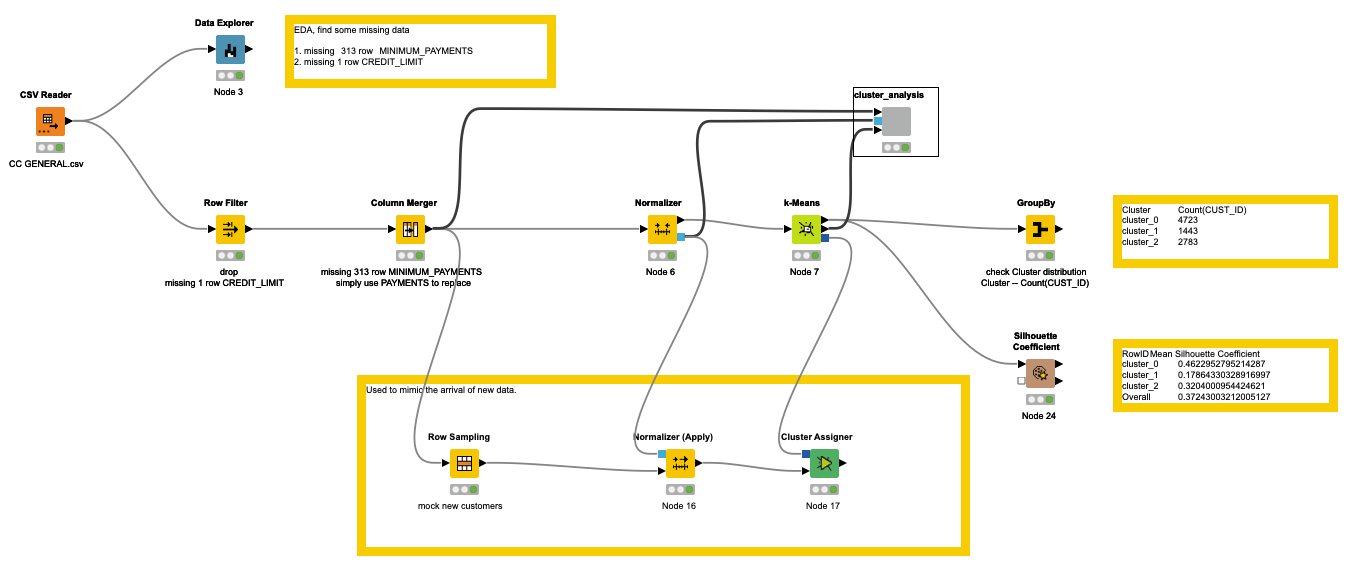
- Firstly, I utilized the Data Explorer node to thoroughly comprehend the data and identified two columns with missing data.
- I employed two simple techniques, Row Filter and Column Merger, to fill in the missing data.
- To ensure consistency within the data, I then normalized it.
- Lastly, I directed the data to the k-Means node.
In order to simulate the arrival of new data, I selected several nodes such as Row Sampling, Normalizer (Apply), and Cluster Assigner.
Cluster Analysis Part
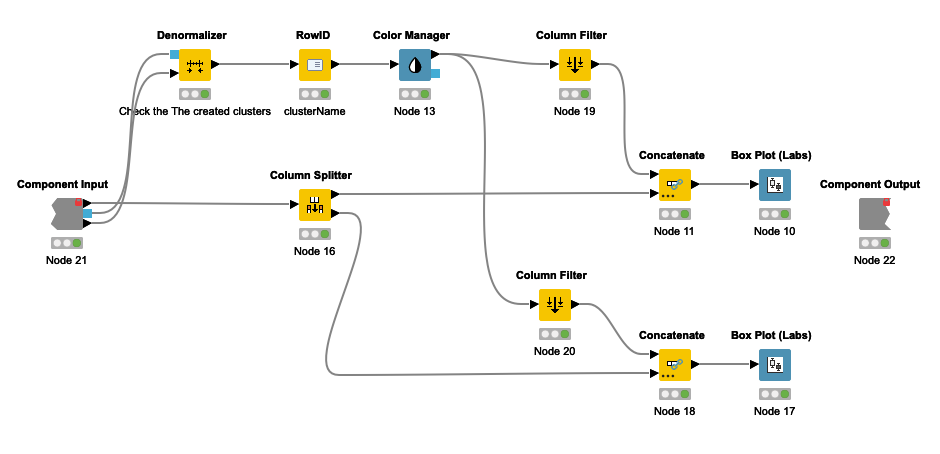
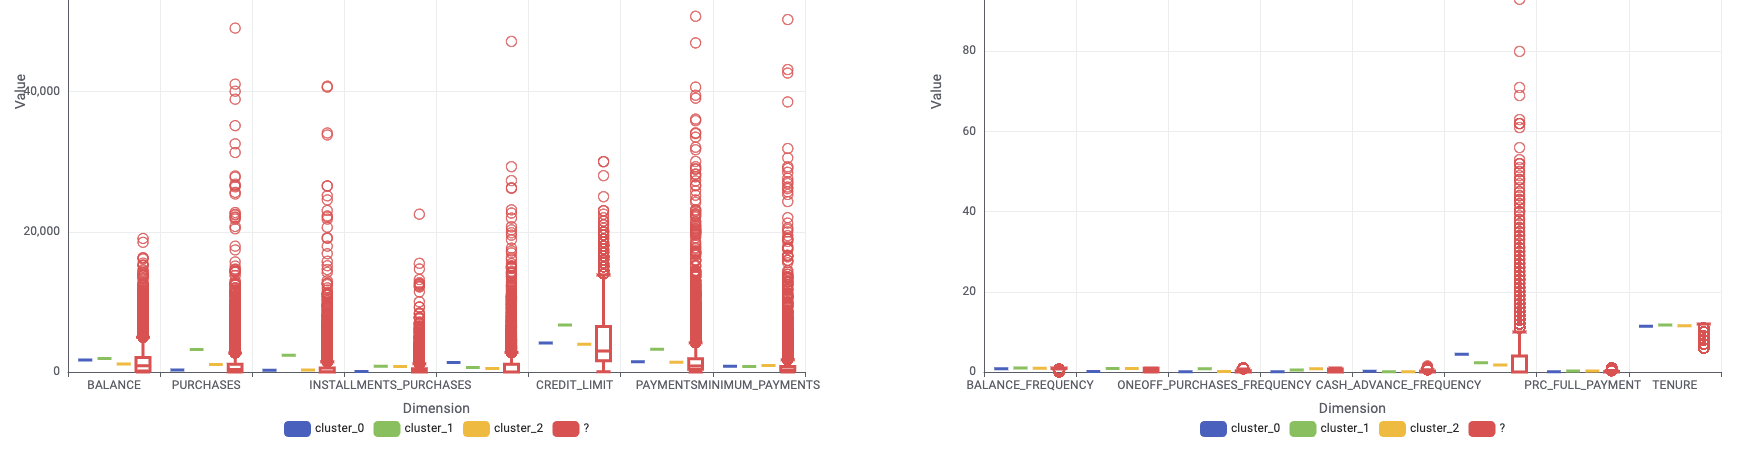
This section discusses the denormalization of the cluster center using the denormalizer node and color-coded identification. Additionally, the categorization of data features are based on size ranges and are illustrated in the two Box Plot.
For instance, cluster_0 indicated low purchase and installments, but high cash advance and transactions. In contrast, cluster_1 showcased higher purchase, one-off purchase, balance, credit limit, and payments. Cluster_2, on the other hand, is more average, and requires more in-depth analysis.
The analysis suggests that cluster_0 users primarily use credit cards for cash advances and less frequently for purchases. For credit company, the next step should include methods to encourage credit card use for purchases. On the other hand, cluster_1 features high-value users that require additional features or personalized interests to retain them.
More work needs to be done to refine the analysis, such as exploring the balance-to-credit-limit ratio, purchase-to-balance ratio, and employing more advanced clustering algorithms. However, for this analysis, this is sufficient.
Another thoughts
KNIME's official answer is simpler and better interpreted, it uses only a few features and goes for clustering, and the clustering metrics are indeed a bit better.