🥷 [S2] Challenge 03
· 阅读需 1 分钟
Just KNIME It, Season 2 / Challenge 03 reference
Process
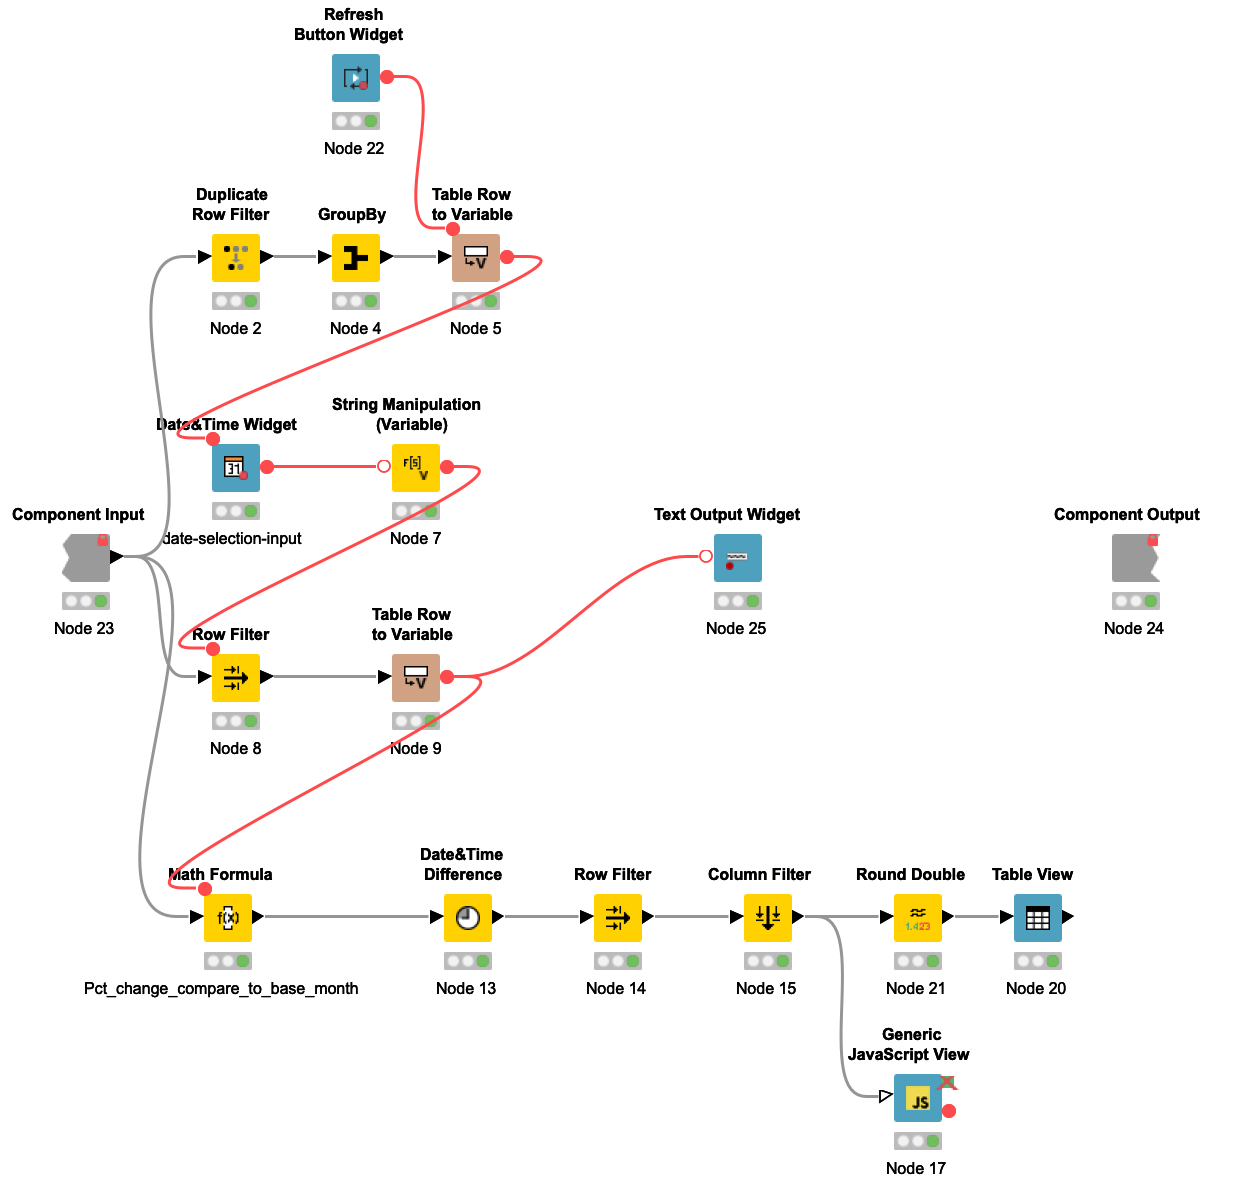
-
Retrieve the date range and set it as the minimum and maximum dates in the “Date&Time Widget” node.
-
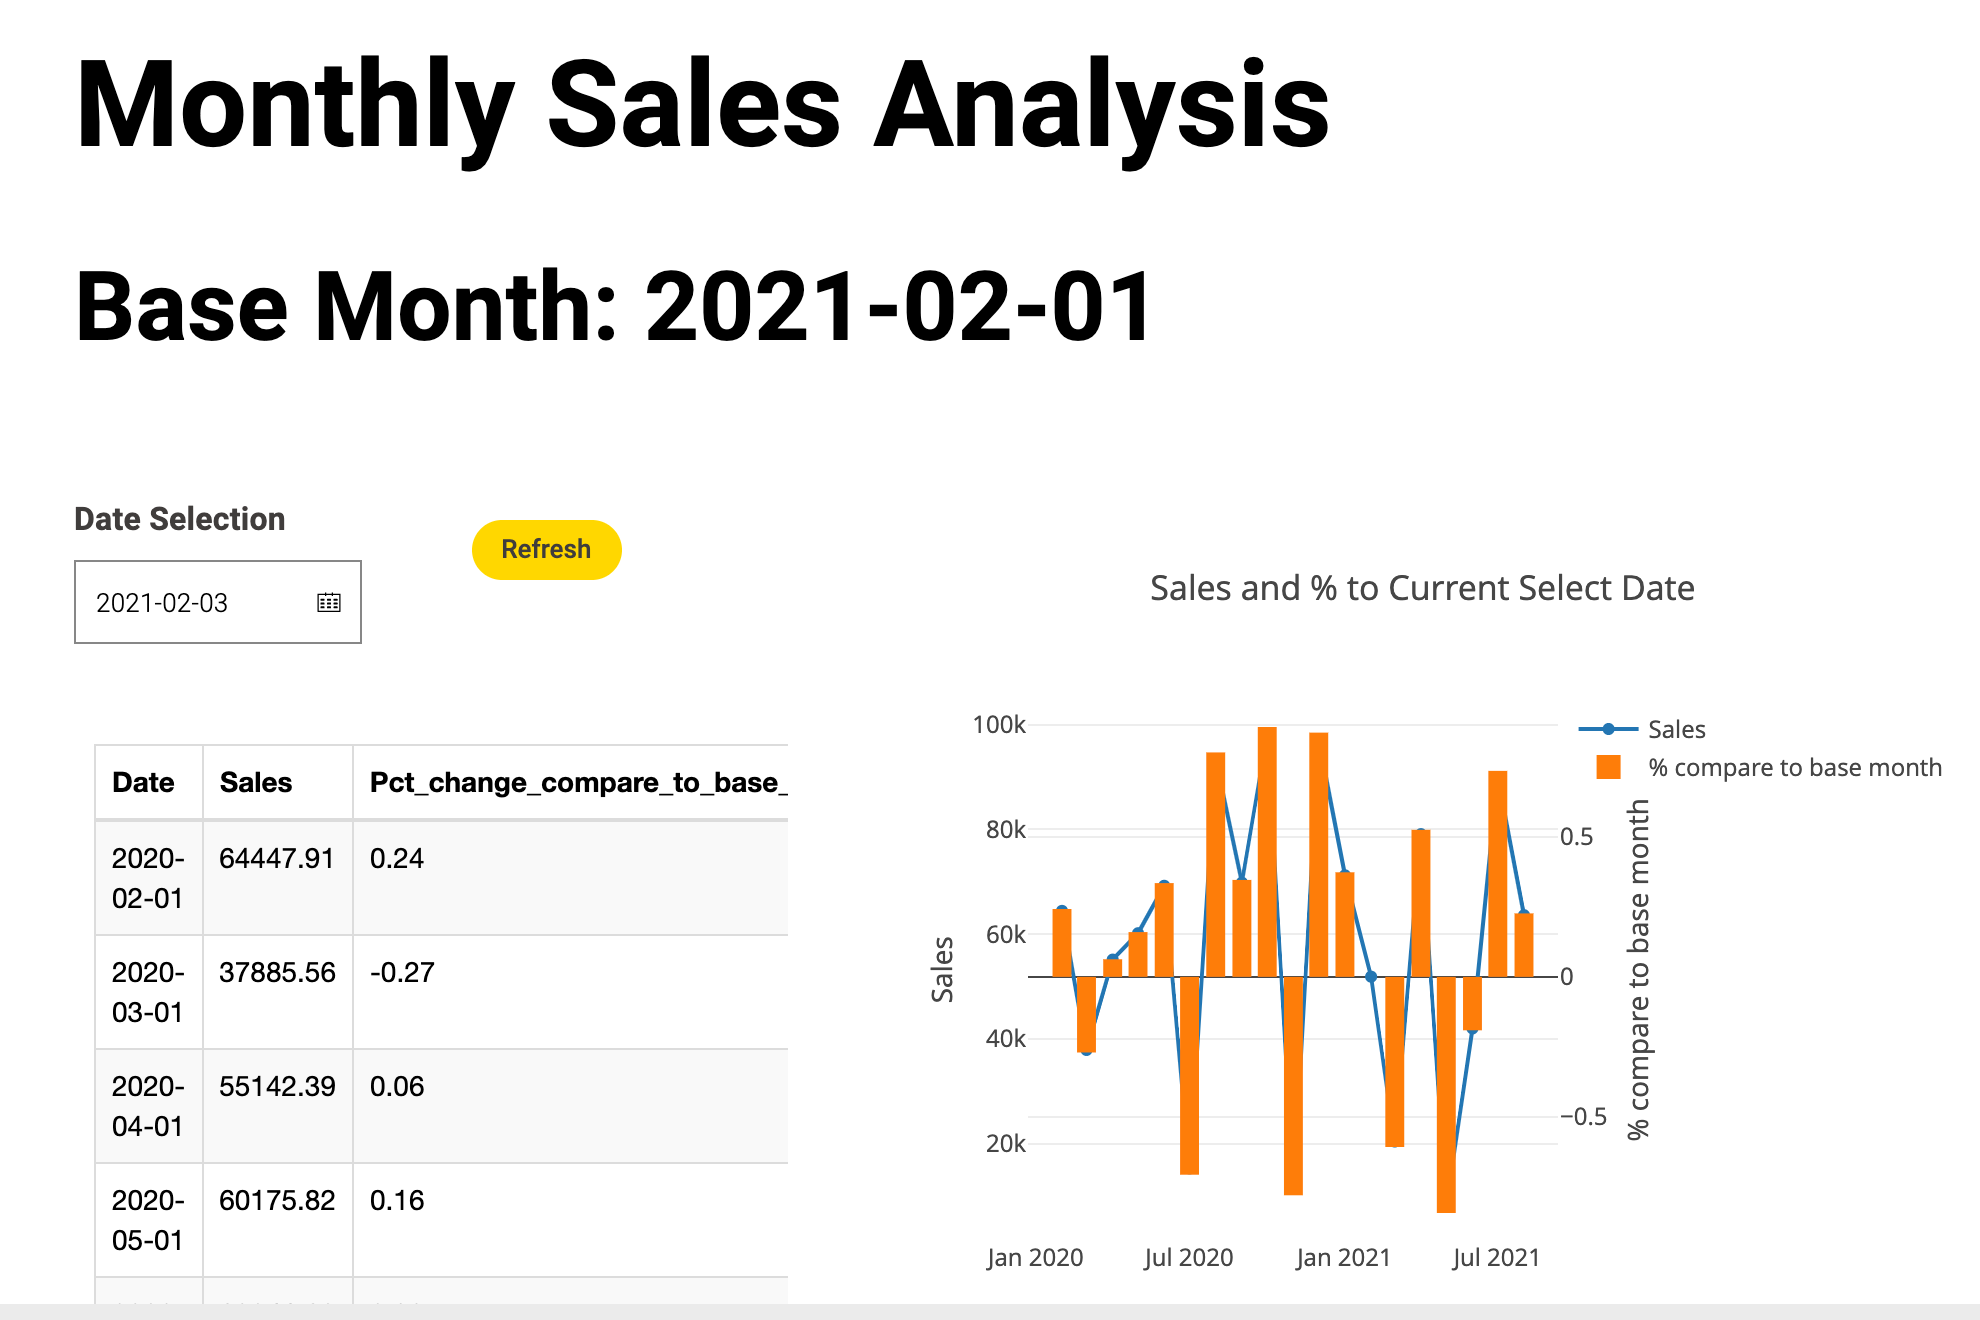
Filter the dataset for the selected month, defined as the Base Month, and calculate the sales for the remaining months comparing to the Base Month.
-
Compare the sales data of the current 18 months, including the previous 12 months and the next 6 months.
-
Visualize the data by displaying it in a Plotly graph.